12 Popular Candlestick Patterns Used in Technical Analysis

Description
Learn how to read candlestick patterns and the 12 most popular candlestick patterns that every trader should know. Here’s an explanation of 12 basic candlestick patterns you need to know.
Analyzing and predicting the price movement of an asset is very important for a crypto investor. One of the most popular types of crypto forecasting is candlestick patterns of the asset price. Let's talk about this type of prediction today.
Why Do Candlestick Patterns Matter?
One of the main principles of technical analysis says that any market situation you fix on a chart will repeat itself. After some time. The market is cyclic, it moves in certain waves. The price on the chart, from time to time, forms various candlestick shapes (patterns), the appearance of which can herald certain events. For example, the continuation of growth, a reversal, a sharp drop in value, and so on. That is why additional indicators such as CandleStick Patterns are used for searching such patterns and making forecasts.
How are Candlesticks Formed?
Candlesticks demonstrate the price movement of an asset, which is accepted worldwide. When electronic trading appeared, the necessity of making an objective reflection of the market's dynamics, which would be transparent for all participants. CandleStick Patterns are well suited for this purpose.
The candlestick is formed from the complex data about the price at the chosen period: trade opening, closing price, maximum, and minimum. This can be data at a minute, five minutes, 30 min, an hour, a month, or even a year. For example, if we take a time frame of an hour, each candle will show the price movement within that hour, if a minute - within a minute, if a week - within a week.
Trading Rules
The main objective which attracts traders to the market is an opportunity to make a profit through trading. This requires using accurate and reliable data so that each market participant may analyze the price movement and use their own experience and psychology of the market cycles. The candlestick chart, in this case, is a very convenient and practical tool that displays price changes—visualized, reliable, using the reflection in time. Thanks to the candlestick chart, every trader and investor can easily determine the direction of the price movement and use it in their trading.
How do you read a candlestick chart?
The essence of using candlestick patterns is to reflect the information about the market and, based on this information, to predict the outcome of events. Several indicators reflect the intensity of the market, its movement, and the prevailing moods of investors. These include the opening price, closing price, maximum and minimum in the selected time range, the strength of the buyers' or sellers' momentum, and the candle's color. Based on this data, the investor will be able to predict future changes and answer the questions:
Where will the price of the asset go in the next time range? What is the prevailing market sentiment? What will be the strength of the next impulse?
Making sense of market jargon
For many users, market jargon can be confusing, especially for newcomers. Let's start by recalling the basic definitions for the candlestick pattern.
Trend - the wave movement of the asset price, which characterizes the priority movement of the market. It is often reflected on the chart by a complex of large candlesticks.
Rollback - a temporary correction of the rate to accumulate liquidity. A series of small candles characterize it.
Flat - the sideways movement of prices without a certain impulse. It is characterized by many small candles in one price range.
Price impulse - the characteristic of the exchange rate movement, which expresses an asset's strength of growth or decline.
Timeframe - the time range used for price analysis.
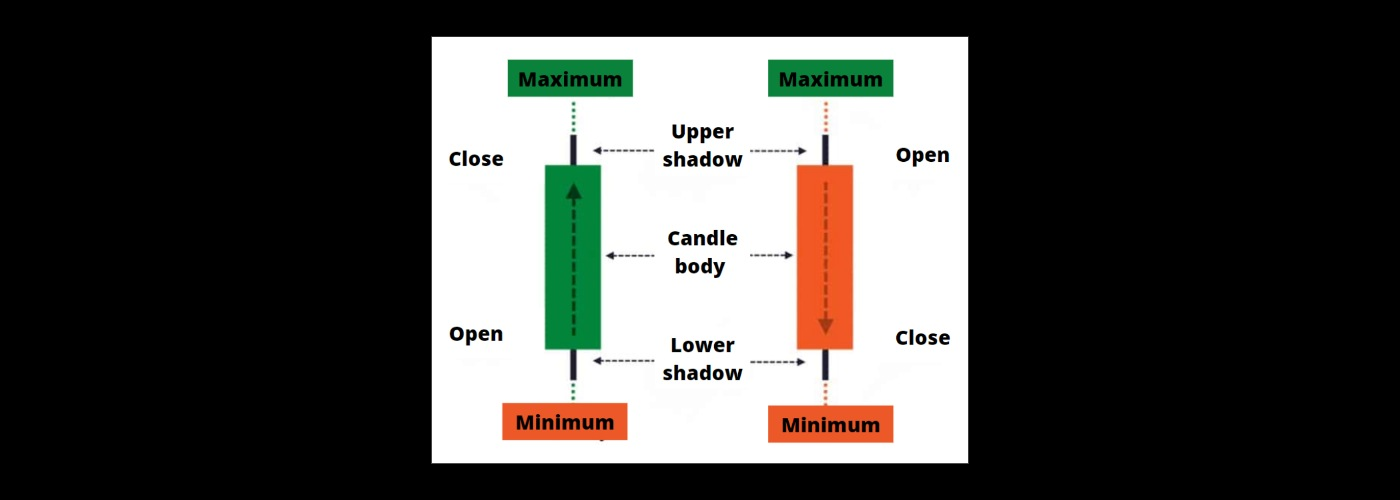
Candlestick body - a data set on the price changes in the selected period (the first and last trade), expressed graphically.
The shadow of a candlestick - the distance that an asset's rate has traveled from the minimum to the maximum price during a time frame.
Doji - one of the types of candlestick charts. It assumes the absence of a candlestick body and long shadows.
What Is a Candlestick?
Candlestick is a specialized chart. Information from a single candlestick gives data about the state of prices in the present, while a complex of candlesticks is an opportunity to predict the rate or look at data from the previous period.
A candlestick consists of several indicators: the candlestick body, the maximum and minimum price in the selected period, and the opening and closing price of the trades. More details are presented in the image.
What Is a Bullish Candle?
If the closing price is higher than the opening price, the candle turns green and is called bullish (the market is dominated by buyers - "bulls"). This is a positive time when the price of the chosen asset is rising.

If the market is experiencing a dominant "bullish" mood: the buyers are very active, which markedly increases the value of an exchange asset. This sentiment is reflected in a confident green color in the candlesticks on the chart.
In the case of a small bullish candlestick, you can talk about the timid attempts of the "bulls" to explore the market, hoping to guess the future direction of the price. If the chart clearly shows several small bullish candlesticks following one another, you can most likely talk about the consolidation and further growth of the asset.
What Is a Bearish Candle?
If the closing price is lower than the opening one, the candle gets red and is called a bearish candle (a bear is a seller).

Accordingly, the chart will reflect red ("bearish") candles if the market is dominated by negative bearish sentiment. And traders start talking about downward trends.
More information is provided by the candlestick pattern - a chart consisting of several consecutive candlesticks, which may be both "bullish" and "bearish. It is a perfect way of telling if the market is bullish or bearish.
Bullish candlestick patterns
Bullish candlestick patterns are very popular. A trader may watch them for months, hoping for growth. Let's talk about the TOP most popular candlestick patterns.
Hammer

Bullish candlestick patterns Hammer is one of the main market patterns, presented as a single candle with a small body and a long bottom wick. The formation of the Hammer candlestick pattern occurs at the base after a downtrend. The appearance of Bullish candlestick patterns Hammer on the chart signals the beginning of a new bullish rally and can be used not only in cryptocurrencies but also in currency, financial, stock, or commodity markets.
Bullish Engulfing
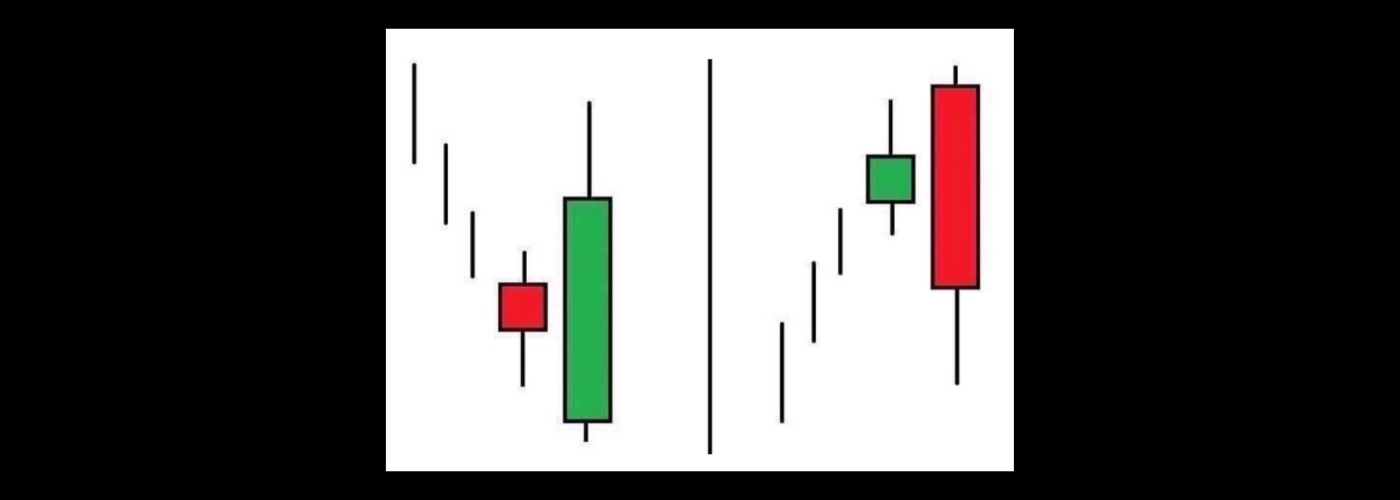
Another classic model for the market. It exists in both bearish and bullish patterns.
It is a so-called reversal pattern, it doesn't matter how the price moved before the pattern, eventually, the price will turn around anyway. If the price went downward and there was an absorption (significant impulse movement in the opposite direction from the trend), the price will reverse and go up, and we will see a bullish absorption. If the price was growing, and after the figure began to fall, it would be a bearish takeover.
A preceding upward trend characterizes a bearish takeover, the first candle is green, and the second candle is red.
A preceding downward trend characterizes a bullish takeover, the first candle is red, and the second candle is green.
Evening Star
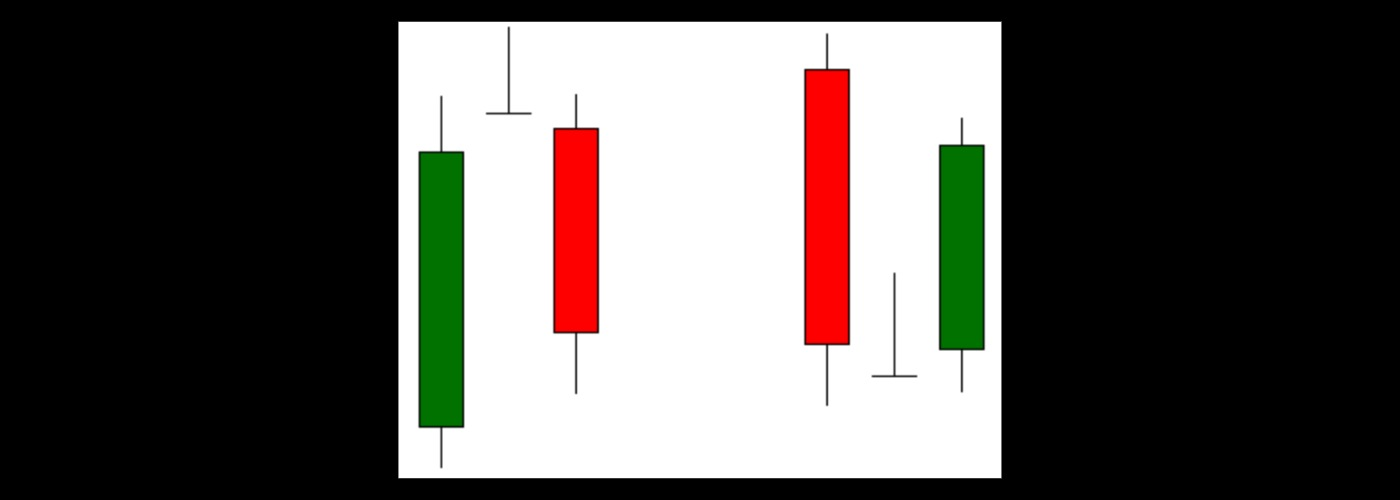
Like previous patterns, the Morning Star pattern exists in two versions: for a bear market (Evening Star) and a bull market (Morning Star). The reversal pattern "star" is made up of three candles. A downtrend precedes the Morning Star and is a precursor to an upswing. The evening star, on the contrary, signals a downward reversal of the uptrend.
This is the strongest candlestick pattern, and it should be understood that the market will soon reverse.
Morning Star consists of three consecutive Japanese candlesticks:
- The first is a bearish candle with a long red body;
- the second, with a short body with a downward gap and a long lower shadow;
- and a third strong bullish candlestick with a long green body should overlap most of the red body of the first candlestick.
Three White Soldiers
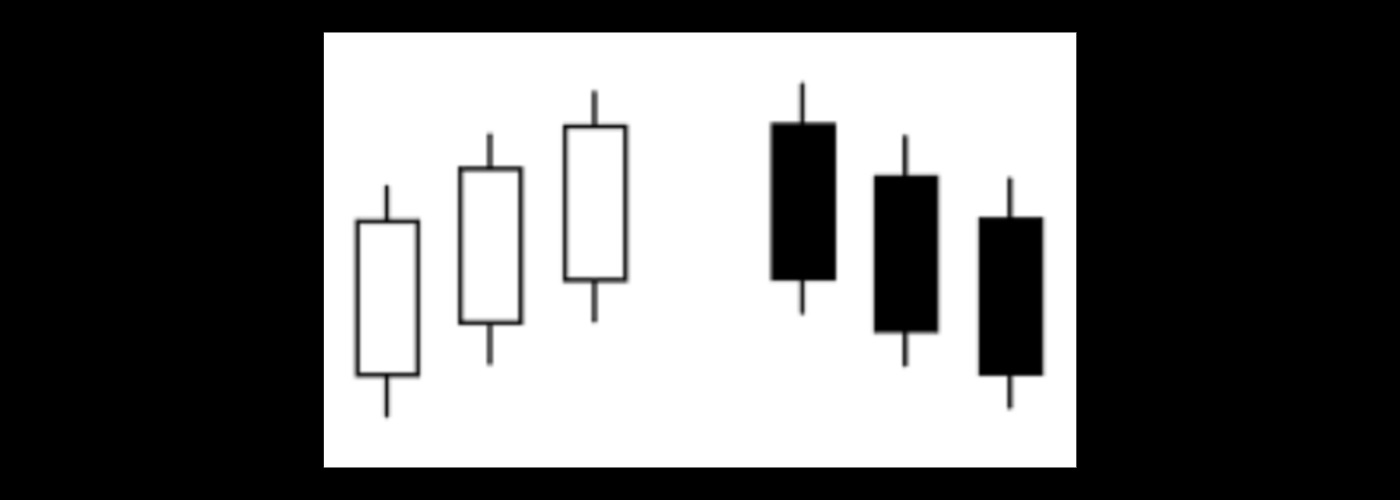
Three white or three advancing soldiers is not exactly an unambiguous candlestick pattern. Depending on the place of appearance and the size of the candlesticks, it can mean the strengthening of the bullish trend and its extinction. The model "Three white soldiers" should meet the requirements:
- The closing price of each successive candle is higher than the previous one;
- the opening prices of the last two candlesticks are in the upper (or higher) part of the previous candlestick's body;
- The shadows of the candlesticks should be relatively short or, better yet, absent.
Bearish Engulfing
These patterns characterize the probability of a negative (bearish) scenario in the market. Many patterns represent bearish candlestick patterns and often have a twin - a similar pattern, but only for an upward bull market. These patterns characterize the probability of a negative (bearish) scenario in the market. Let's look at the most popular ones.
Hanging Man

The Japanese "Hanging Man" candlestick is a trend reversal pattern at the top, which warns that the price has hit an insurmountable resistance. It means the bulls' strength is depleted, and they cannot increase the price. A hung candle with a small body and a long lower shadow characterizes the "Hanging Man" pattern. The signs of this pattern:
- The formation of the candlestick pattern occurs exclusively at the top;
- The small body of the candlestick is formed at the top of the price range;
- The upper shadow must be absent or very short;
- The lower shadow must be at least twice as long as the candlestick body.
Bearish Engulfing
This is the inverse of "Bullish Engulfing". It is a so-called reversal pattern, an extremely negative situation when the value of the asset, expressed as three consecutive green candles, sharply decreases and "erases" the previous growth in one-time intervals.
Three black crows

It is also the opposite of the bullish Three White Soldiers pattern. These are three consecutive declines in the asset value shown on the chart.
Neutral or undecided candlestick patterns
Strange as it may sound, but more often than not, the market is not at its peak. The price of the asset is not indefinitely rising or falling. There is also a neutral side, the so-called sideways.
Doji
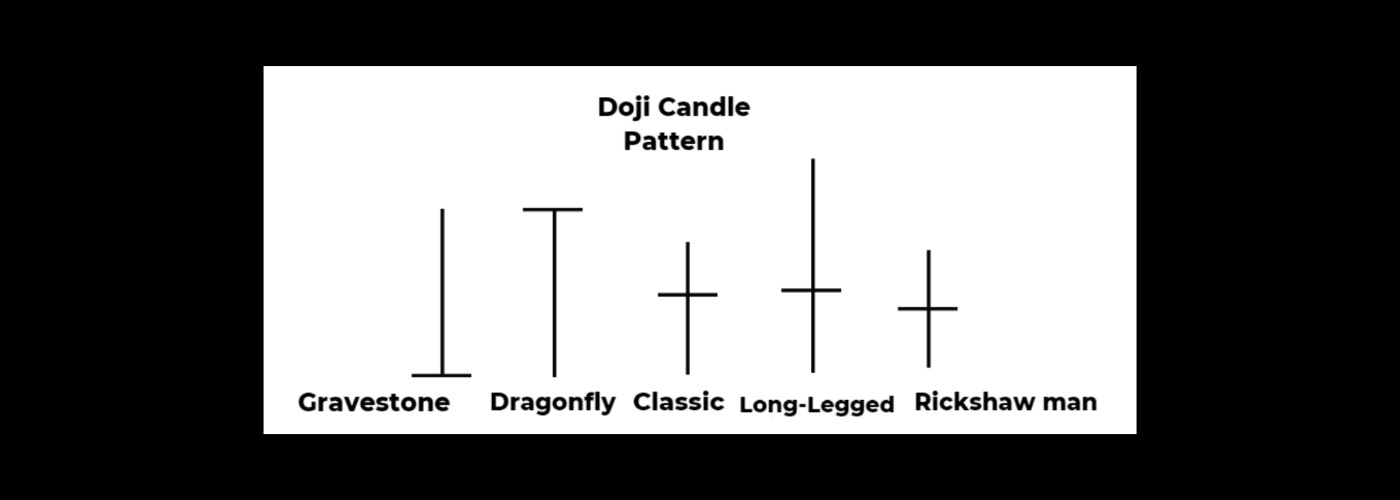
In addition to bullish and bearish candlesticks, there is another type of Japanese candlestick, the doji candlestick. Their body is very small (or completely absent) in relation to the full size of the candle, and most often, the opening price may coincide with the closing price. These candles are formed in a market equilibrium or the absence of large players in the market. There are several types of doji candles: gravestone, dragonfly, classic, long-legged, and rickshaw man.
Spinning Top
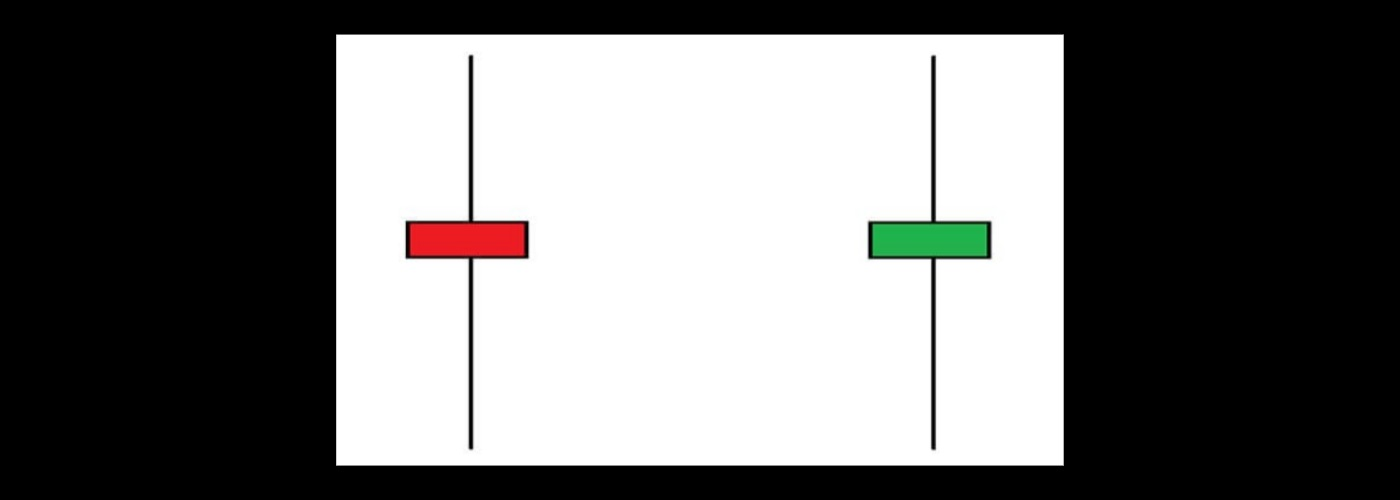
Candlesticks with long upper and lower shadows and a short body are called Spinning Top. They characterize a high degree of uncertainty in the market. The color does not play a special role. The short body and long shadows indicate the approximate parity between the strengths of bulls and bears.
Rising Three Methods and Falling Three Methods
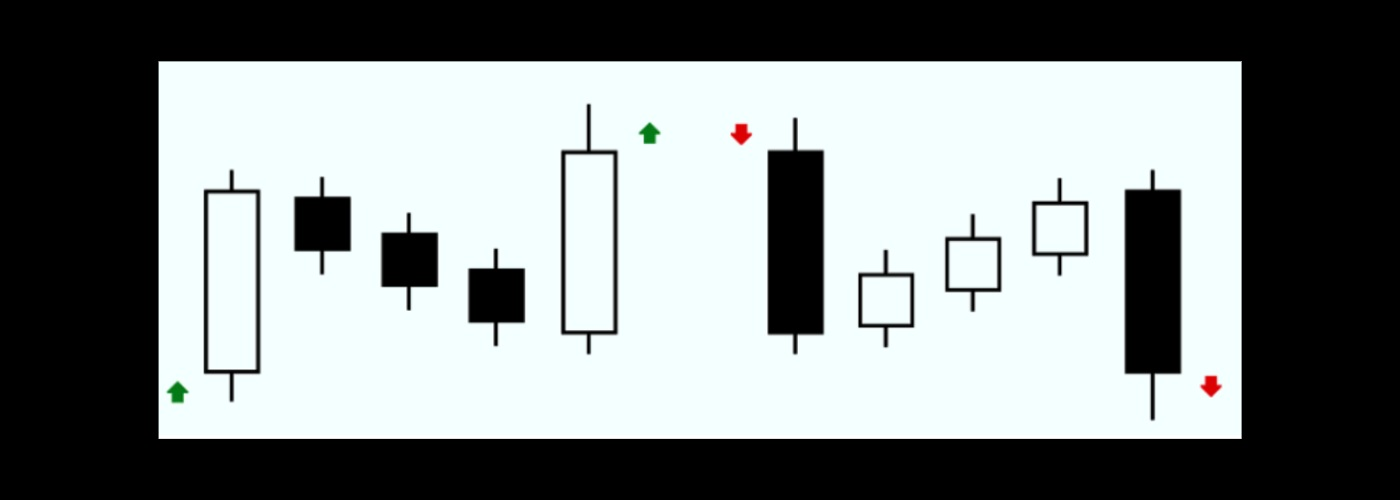
Rising Three Methods and Falling Three Methods is a fairly strong model of continuing the current trend, with an interesting symmetrical structure with five or more candles.
The first candle always corresponds to the current trend (green - growth, red - decline) and has a long body.
Then a series of smaller candlesticks are formed, with short shadows colored in the opposite direction to the first candlestick. All the stars should be located within the first candle of the pattern.
More complex patterns
The "Rising Three Methods and Falling Three Methods" is formed by the appearance of the last candle. This candle duplicates the qualities of the first: the color according to the trend, it has a large body. Obligatorily, the closing price of the last candle should be higher than the maximum price of the first candle for a bullish pattern or lower than its minimum price for a bearish pattern.
"Double Top pattern" and the "Double Bottom”
What other patterns are popular with traders? Let's take a look at the most interesting reversal patterns: the "Double Top pattern" and the "Double Bottom" pattern. As you can see, like in the previous examples, there is a bearish and bullish pattern.
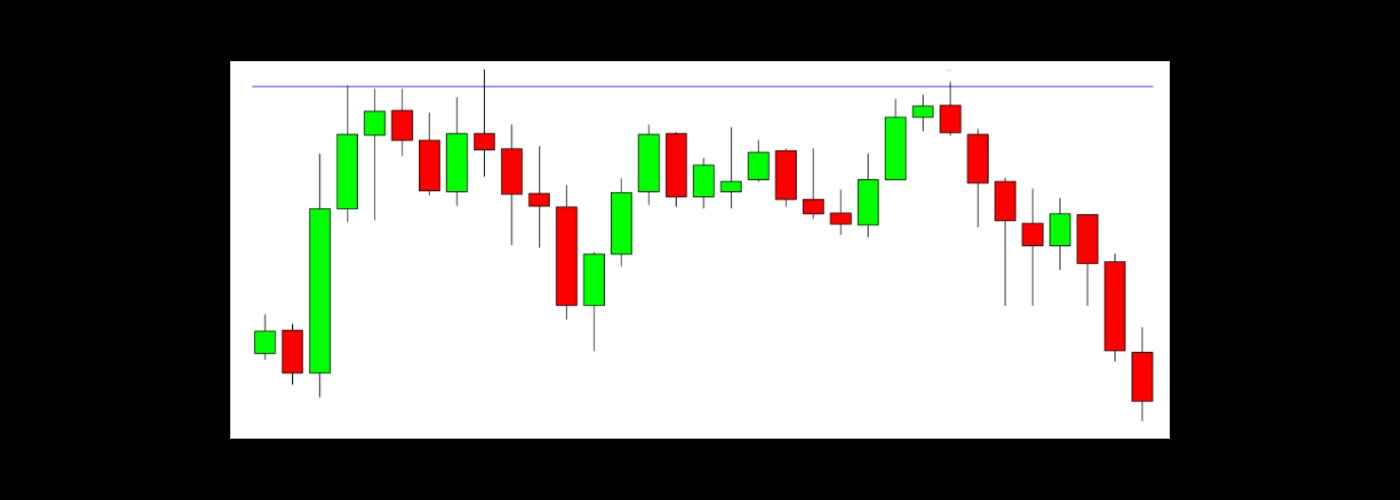
The Double Top pattern is often formed after an upward movement, with a local renewal of the maximums. It is represented as two rate tops on the chart, which follow each other. The minimum point between these tops is the horizontal support level. This pattern is considered formed after the price returns to the baseline. After that, the trader should fix the profit, as further, it will decrease.
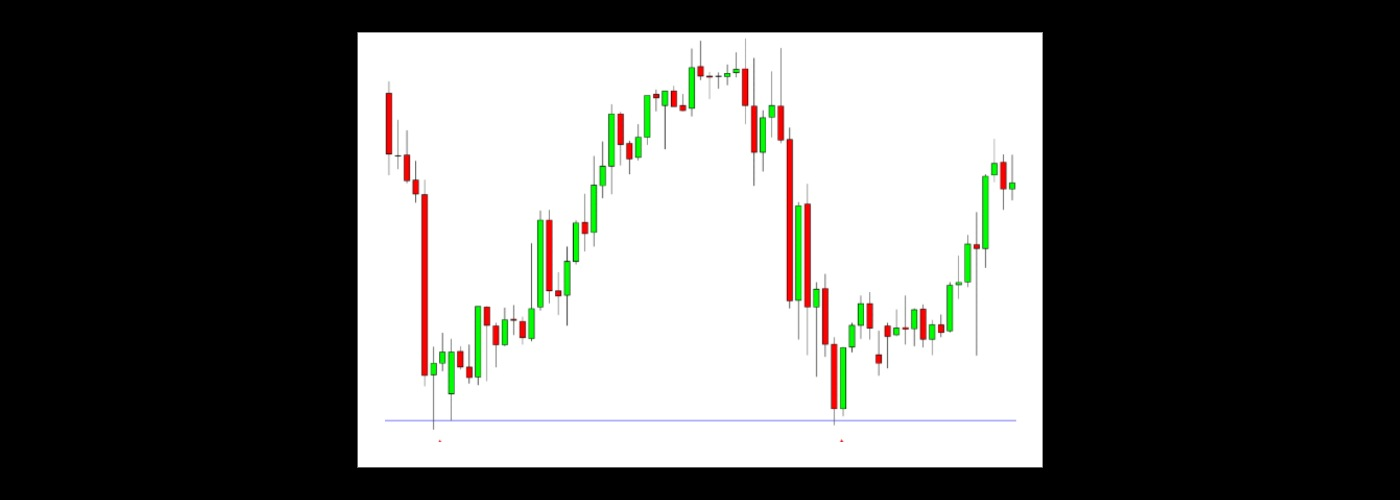
The pattern "Double bottom" has the opposite characteristics. It is formed after the downward movement at the local minimum of the chart and is represented in the form of two consecutive decreases in the asset rates. This pattern, unlike the "Double Top", is an omen for the future growth of the price.
"Triple Bottom" and "Triple Top"
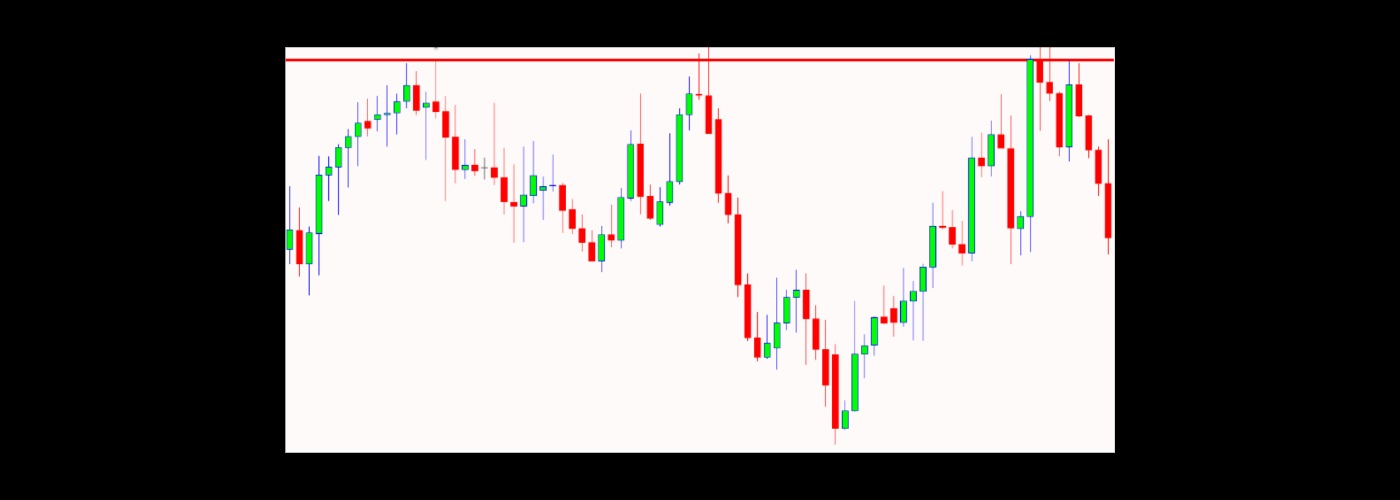
In addition, there are even more complex patterns on the chart. Close to the patterns "Double Top" and "Double Bottom" are "Triple Bottom" and "Triple Top". These are also reversal patterns, after the occurrence of which the price movement of the asset changes.
The "Triple Top" pattern is characterized by its appearance on an uptrend. It represents three consecutive tops on the price chart, which approximately repeat one another. The bases of the tops form a resistance line, after passing, which the rate will decrease. "Triple bottom" acts vice versa. It is characterized by a long decline in the asset, three similar rate dips, and the subsequent rise in value.
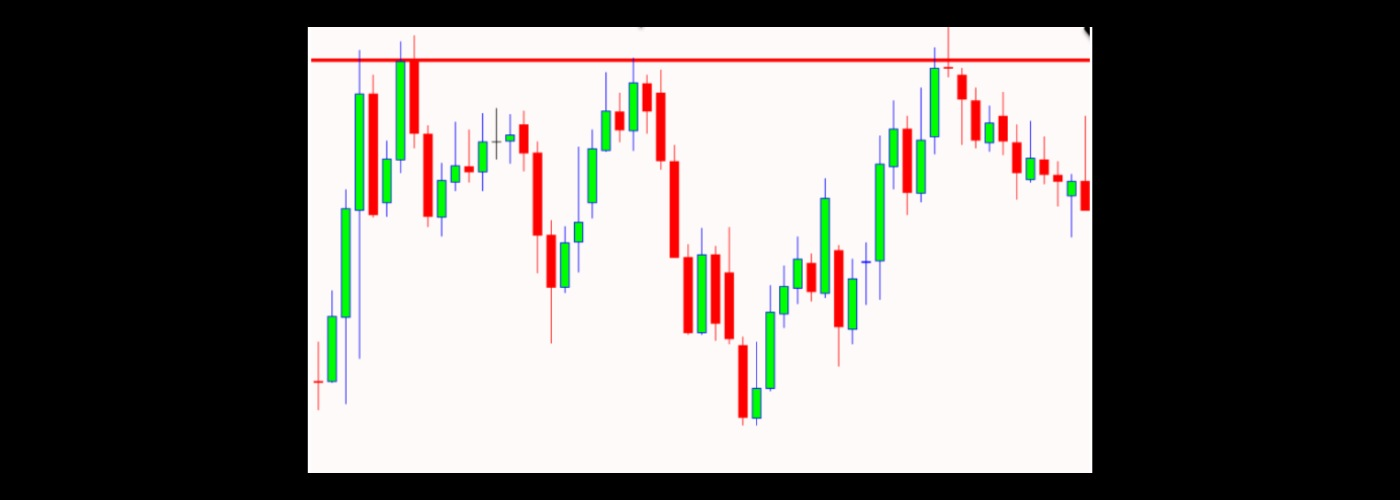
Head and Shoulders
The "Head and Shoulders" pattern gets its name because a set of consecutive candlesticks forms an image resembling a human head and shoulders. As a rule, it is formed in the ascending market. After the price closes below the resistance line, the pattern is considered to be fully executed. Some market decline follows, that's why traders consider the "Head and Shoulders" appearance as a signal to sell.
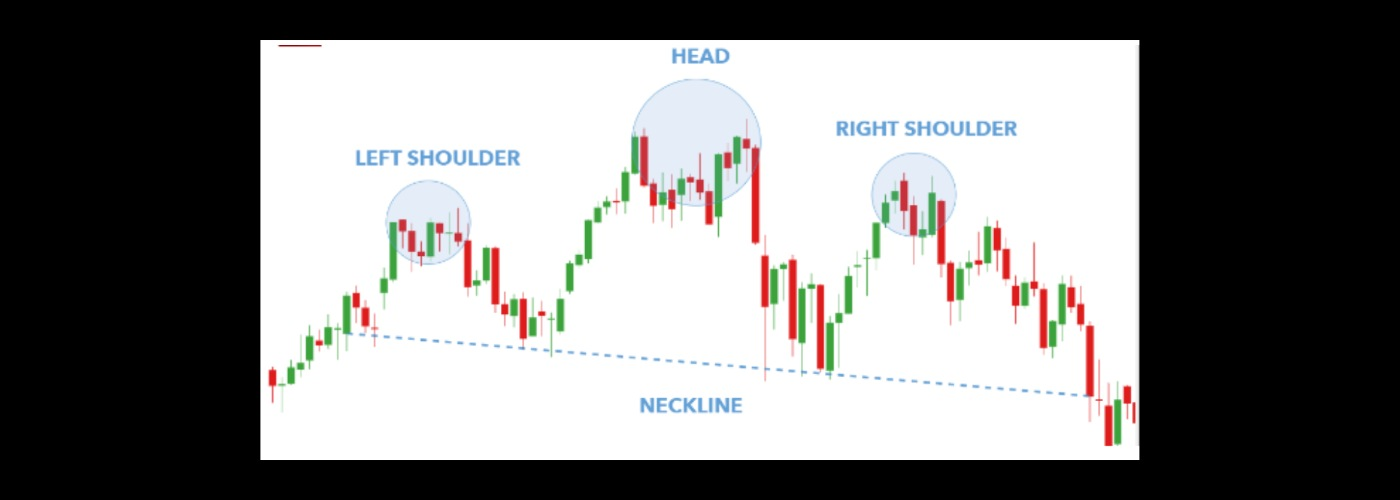
On the contrary, the graphical pattern "Inverted Head and Shoulders" is formed in the descending market and signals to the trader about the necessity to buy.
Rectangle pattern
Most market indicators work only on a precise movement: up or down. But how to analyze the rate if the price is moving sideways now? There is a "Rectangle" pattern for this purpose.
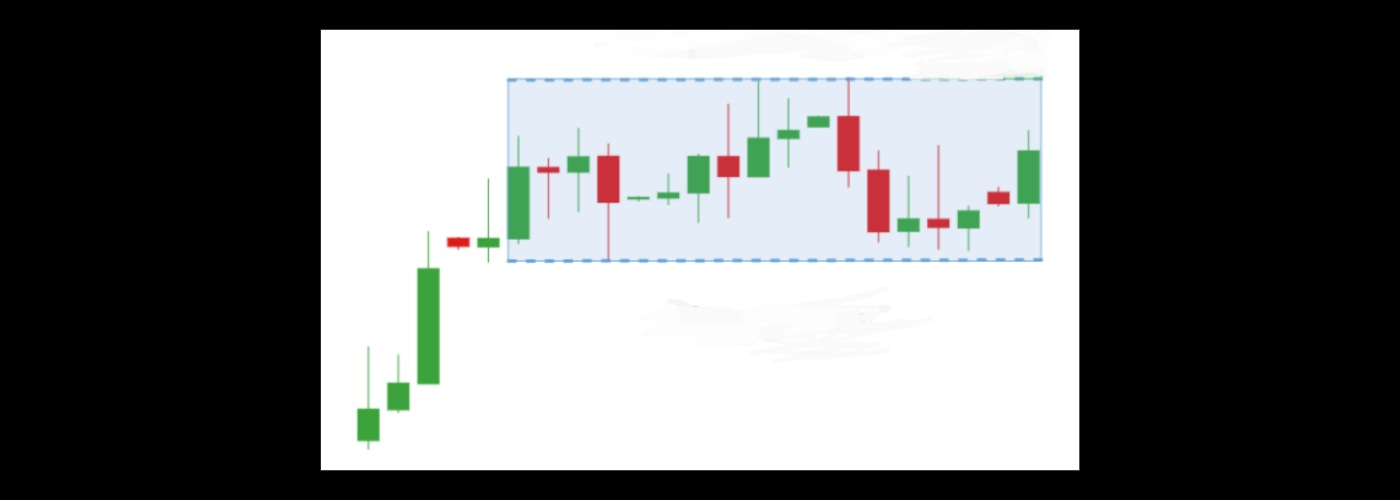
A "Rectangle" pattern can portend either a reversal or a continuation of the current trend. It is not a reversal pattern. It all depends on the direction in which the chart exits the pattern: if it is up, it will be up, if it is down, it will be down. It looks like a sideways corridor with equivalent candles that cancel each other's influence.
Conclusion
Candlestick patterns on price charts are very informative. This type of information is suitable for many people. It combines visual and statistical information, which is very informative. This type of information is a priority for many traders. That is why every person who invests and analyzes asset prices should know at least basic knowledge about candlestick patterns and be able to apply it in practice.