How to read candlestick charts: an introduction for beginners
Description
How to read and interpret candlestick charts for cryptocurrency trading? Tips for beginners on how to read and analyze candlestick charts for intraday trading
Candlestick graphs and charts: what is it? What are the definitions?
Candlestick charts have their origins in Japan. Around the 18th century, trader Homma figured out that the price and demand for rice are strongly influenced by the emotions of those who buy and sell this commodity.
The modern market uses many indicators to help traders trade deals, whether it is stock or cryptocurrency. One of the most famous and popular is the candlestick chart. A candlestick chart is a visual representation of the size of price fluctuations. A trader uses a candlestick/diagram to identify a particular trading pattern to predict the short-term direction of a stock or asset's value. A candlestick chart includes several components.
What does a candlestick chart consist of?
As stated earlier, a reading candlestick chart includes several elements. It has several bars (candlesticks).
The candle includes three parts:
- Body;
- Upper shadow;
- Lower shadow.
The body, in turn, is also colored in several colors:
- Red;
- Green.
Candlesticks represent a period, and the data corresponds to the trade made during that period. A candlestick has several data points:
- Open – this is the first trade for the period specified by the candlestick;
- High – the most significant traded value;
- Low – the minimal traded value;
- Close – the last trade in the period specified by the candlestick.
How to analyze a candlestick chart correctly?
In specialized forums devoted to trading stocks or cryptocurrencies, novice traders often ask how to read candlestick charts for day trading.
As we know, the candlestick body is the value of opening and closing trades in the market, which were made within a certain period. A trader can determine the price range for a particular stock over a specific period. By what color the body has, one can know if the value of a stock or cryptocurrency is increasing or, conversely, decreasing.
For example, if the candlestick chart shows over a week or month, the candle that represents the day has more red, respectively, which indicates that the value of the asset or stock is going down. Conversely, if a candle stick reading represents a day with more green in the chart during a week or month, the value of the asset or stock is going up.
The body of the candle has upper and lower wicks (shadows). They show the cryptocurrency or stock's minimum and maximum traded value.
The candlestick chart shows the relationship between a stock or cryptocurrency's high, low, opening, and closing prices. In turn, the body can be long, short, red, or green. The shadows also come in long and short.
Thus, by reading the candlestick chart, a trader can find out what emotions are prevailing in the market for investors, see the connection between who is selling and who is buying, and so on.
At the same time, the trader must not forget that although the individual candlesticks provide a certain amount of information, you need to know the other nuances of the candlestick chart.
To better understand how to read candlesticks, knowing the other candlestick charting patterns is necessary. This can be done with the help of patterns.
What are candlestick chart patterns?
You can refer to patterns to have more information on how to read a trading chart. Patterns can be bullish or bearish. They help you better understand how to read candlestick charts at a more professional level.
Bullish patterns
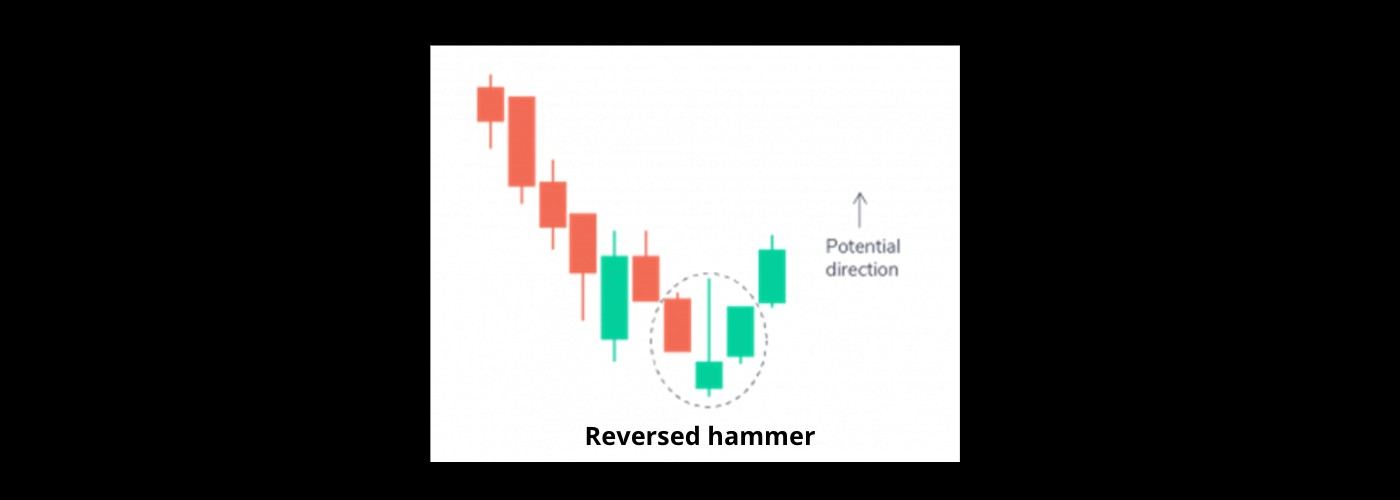
There are some of the most famous bullish patterns at the moment. This is dubbed “reverse hammer”. The candle has a short body and a long upper wick. This pattern shows that buyers are putting pressure on the stock. It also means that buyers will have control of the market.
There is also a pattern called “bullish absorption”. This pattern consists of 2 candles. A bigger candle in green absorbs the first short candle in red. This pattern shows that bulls dominate the market, and the value of stocks or currencies will at least rise in the short term.

There is also such a model as the “morning star”.

This pattern is made up of 3 candles. One candle has a short body and is located between the red one and the green one. These candles are long. This pattern indicates that the sellers can't control the market as before, and a bullish cycle begins.

Another common model is the “3 white soldiers. This model has 3 green candles, and they have small wicks. They may indicate that a bullish trend is about to begin in the market.
In addition to bullish patterns, there are bearish patterns.
Bearish patterns
Some patterns are most common in the stock or cryptocurrency markets. In particular, the “hanging man” pattern belongs to them.
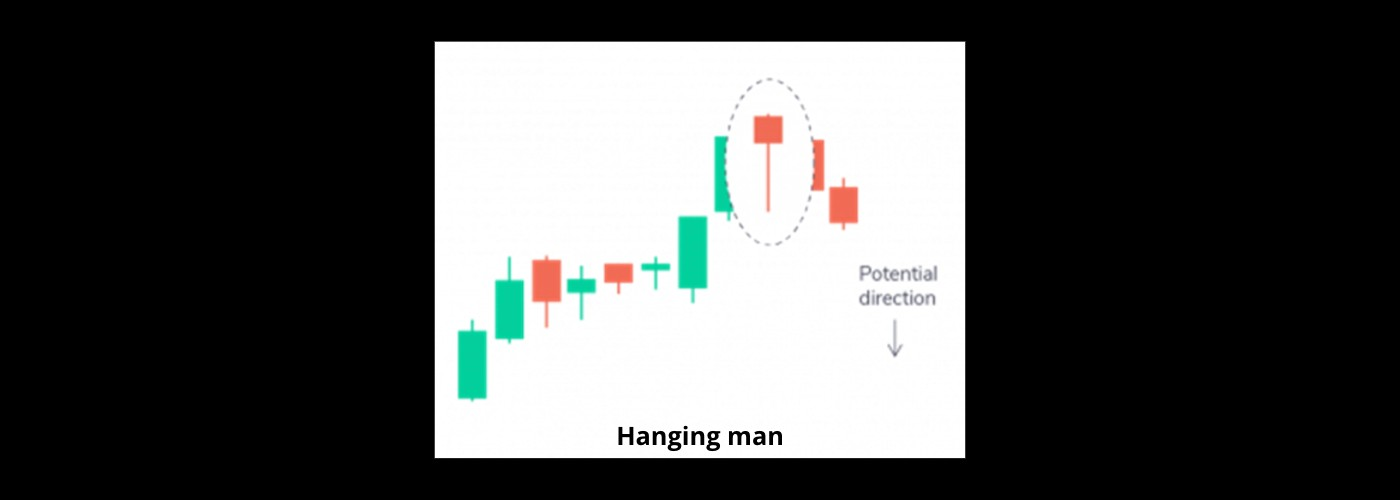
It represents a candle with a short body and a long bottom wick. Such a pattern indicates that the bears will soon have complete market control.

There is also a model called “shooting star”. The candle's body is short, and the upper wick is long. It shows that the sellers began to take over the market and soon will completely dominate it.
There is also such a model – “3 black crows”.

In this model, there are three candles. They follow each other, and their wicks are short. It shows that bears will soon dominate the market.
Conclusion
To understand how to read candlestick patterns, you need to study fundamental and technical analysis and use the guides of experienced traders.
At any period in the market, the moment may come when the situation drastically changes, and it will be necessary to adjust trading strategies. Nevertheless, with the help of a candlestick reading chart, a trader can work out his strategy of action on the market.
The more experience the trader has, the better he understands how to read charts for intraday trading and adjust his actions at different times.