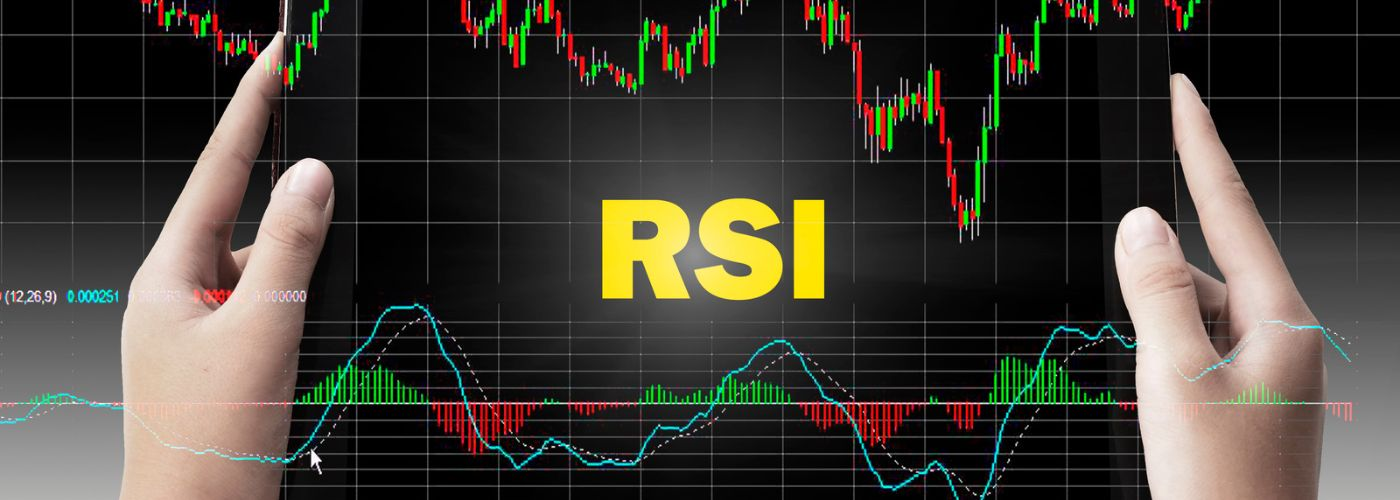
How to trade using RSI?
Description
The relative strength index or RSI indicator is important for a crypto trader. We will explore how to use the RSI indicator, the RSI algorithm, and its essence in our material. Here is everything to understand RSI's meaning.
The relative strength index or RSI indicator is important for a crypto trader. We will explore how to use the RSI indicator, the RSI algorithm, and its essence in our material. Here is everything to understand RSI's meaning.
What is RSI indicator
The RSI (Relative Strength Index) measures the relative strength of a trend. In fact, it's an oscillator (oscillators show fluctuations within a certain range). This indicator analyses the price chart data and helps traders estimate the prospects and forecast the changes in the market quite precisely.
The Relative Strength Index or RSI indicator is one of the various tools for analytics and data collection in the cryptocurrency market. This indicator is as important as MACD (Moving Average Divergence and Convergence), Bollinger Bands, and Balance Volume (OBV). Digital cash system cryptocurrency is characterized by high volatility and unpredictability, so using indices for prediction is appropriate. Whether users expect halving Bitcoin to predict a bullish rally, work and earn on exchange trading, or use a blockchain network to create a token - regardless of activity, everyone relies on index data.
Who is the author of the RSI indicator
J. Welles Wilder Jr. is the inventor of this indicator. He's also the father of other technical analysis tools, however, RSI is the most significant and most popular one. In June 1978, Wilder published the results of his work in commodities and transformed the trading world. Later, he published an advanced guide on his indicator – a book called "New concepts in technical trading systems." Traders from all financial areas, financial analysts, and technical analysis gurus believe that RSI is an essential indicator, and it's necessary to use it to make the right decisions.
How RSI works and how to use the RSI indicator
As one of the most well-known oscillators, RSI shows the speed and rate of change of price movement; in other words, the momentum. Simply put, RSI shows changes in a trend, its power, and possible changes in a trend. The RSI trading indicator analyses price changes that occurred during a certain period. The RSI chart shows the results on a scale of 0 to 100, while the main levels are 30 and 70 (Picture 1). Readings above 70 mean the asset is overbought, and the ones below 30 mean it's oversold.
Picture 1

Wilder insisted on using 14 candles to get the best forecasts. Using 14 candles means that the strength formula is based on the last 14 candles. EXEX's RSI widget is also based on this optimal option. RSI patterns.
How to trade based on the signals of EXEX widget with the help of the relative strength index
For a certain asset, you can use the RSI widget in the "Trades" section. The scale will have 5 areas with signals.

The indicator RSI finance in trading uses the trend data and the current price to make calculations and shows the levels below and above which the asset is oversold and overbought.
When an asset is overbought (the price line is above 70 while the market is flat – there're no sharp fluctuations), the price line goes back to the 70–30 range (Picture 2).
Picture 2

The classical technical analysis considers this moment as the best for opening a short position – in other words, for selling an asset (see "Article_name") to learn more about short positions). In this case, the widget's arrow points to "Actively sell."

The same works when an asset is oversold, and the RSI patterns indicator crosses back above 30 (picture 3).
Picture 3

Traders believe this is the best signal for a long position or buying an asset (read the "TOP 10 terms for a beginning crypto trader" article to learn more). EXEX widget reminds you about it by moving its arrow to the "Actively buy" area.

But you should also consider that not all trends can be forecast 100% precisely with the help of technical analysis. Sometimes, the news may make the market drop or skyrocket. Therefore, the most reliable and profitable strategies are the ones based on a flat market. Of course, this is scalping first of all because you can usually detect a flat market when you use lower time frames (to learn more about scalping, read our article "What is scalping").
The "Buy" and "Sell" areas of the widgets imply a lower possibility of making a profit because they are based on the RSI levels that are further from 70 and 30 levels. However, you should also note that choosing these options is less risky. Also, using "Stop loss" and "Take profit wisely" (Picture 4) allows you to balance your profits and losses. These tools are obligatory for trading; EXEX developed them to protect you from losses (you can find the information about risk management ensured by the widget in the "Risk management" article).
Picture 4

If the arrow points to "Neutral," it means that, according to RSI, the market is uncertain. If you usually use strong signals to trade or have no time to analyze the charts carefully, it's better to wait for some time.
Conclusion
The RSI indicator is the favorite technical analysis tool of traders from any financial area, be that stock trading, fiat currency trading, or cryptocurrency trading. This oscillator has been one of the most helpful for forming and adjusting trading strategies for almost 50 years. Following its principles, EXEX uses only the best options for its products because the success of our clients is our success, too. The RSI widget, developed based on one of the most effective formulas of the recognized financial guru, is a time-proven technology, now available in a simple and user-friendly format.
EXEX wishes you success and reminds you that using signals is a part of technical analysis; it can't be considered financial advice. To be a successful trader, strengthen your strategies with fundamental analysis of assets and global financial trends, follow the news of the traditional financial markets, and, of course, of the cryptocurrency market.